Technology
Charted: The Exponential Growth in AI Computation
Article/Editing:
Click to view this graphic in a higher-resolution.
Charted: The Exponential Growth in AI Computation
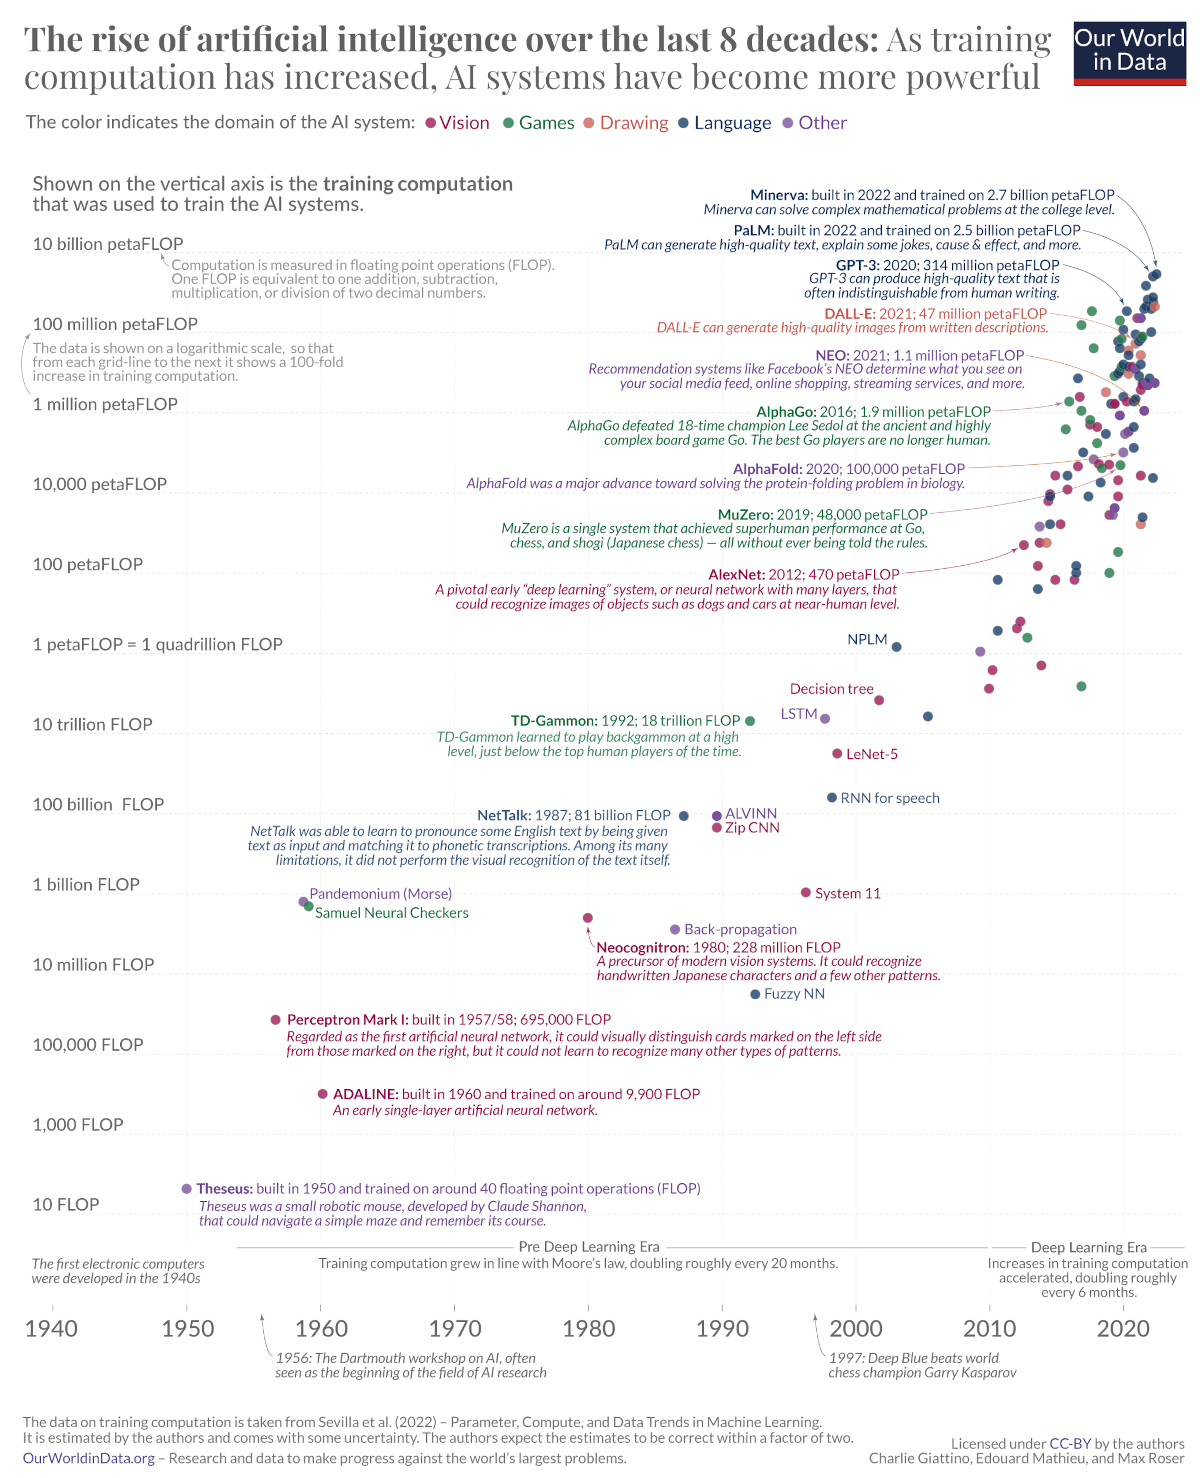
Electronic computers had barely been around for a decade in the 1940s, before experiments with AI began. Now we have AI models that can write poetry and generate images from textual prompts. But what’s led to such exponential growth in such a short time?
This chart from Our World in Data tracks the history of AI through the amount of computation power used to train an AI model, using data from Epoch AI.
The Three Eras of AI Computation
In the 1950s, American mathematician Claude Shannon trained a robotic mouse called Theseus to navigate a maze and remember its course—the first apparent artificial learning of any kind.
Theseus was built on 40 floating point operations (FLOPs), a unit of measurement used to count the number of basic arithmetic operations (addition, subtraction, multiplication, or division) that a computer or processor can perform in one second.
Computation power, availability of training data, and algorithms are the three main ingredients to AI progress. And for the first few decades of AI advances, compute, which is the computational power needed to train an AI model, grew according to Moore’s Law.
| Period | Era | Compute Doubling |
|---|---|---|
| 1950–2010 | Pre-Deep Learning | 18–24 months |
| 2010–2016 | Deep Learning | 5–7 months |
| 2016–2022 | Large-scale models | 11 months |
Source: “Compute Trends Across Three Eras of Machine Learning” by Sevilla et. al, 2022.
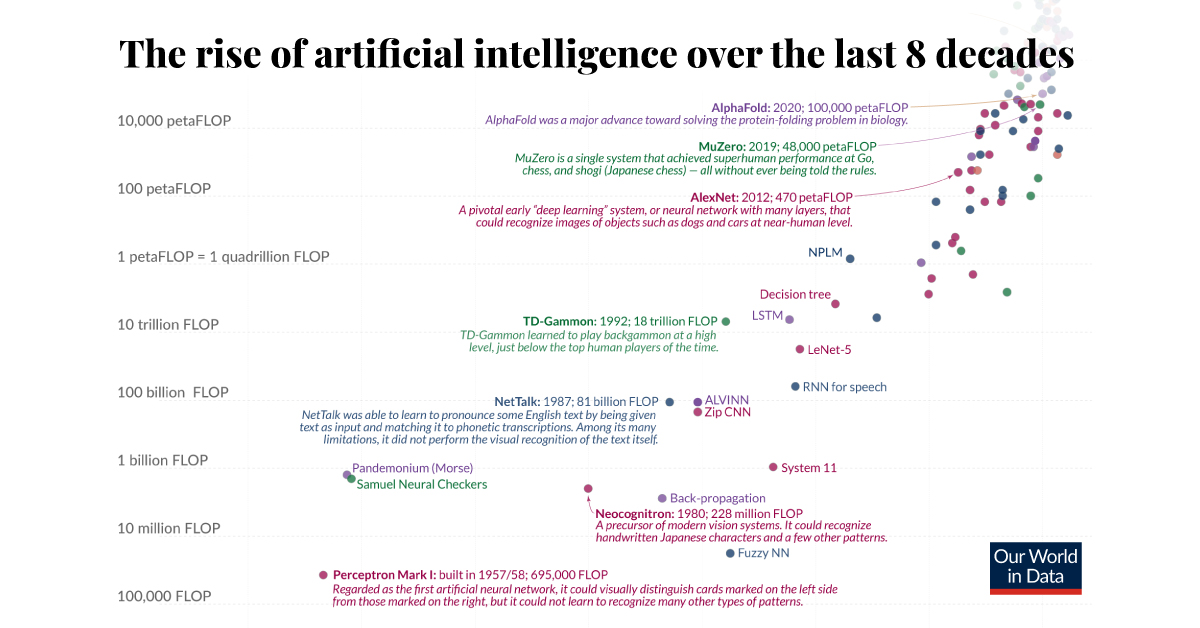
However, at the start of the Deep Learning Era, heralded by AlexNet (an image recognition AI) in 2012, that doubling timeframe shortened considerably to six months, as researchers invested more in computation and processors.
With the emergence of AlphaGo in 2015—a computer program that beat a human professional Go player—researchers have identified a third era: that of the large-scale AI models whose computation needs dwarf all previous AI systems.
Predicting AI Computation Progress
Looking back at the only the last decade itself, compute has grown so tremendously it’s difficult to comprehend.
For example, the compute used to train Minerva, an AI which can solve complex math problems, is nearly 6 million times that which was used to train AlexNet 10 years ago.
Here’s a list of important AI models through history and the amount of compute used to train them.
| AI | Year | FLOPs |
|---|---|---|
| Theseus | 1950 | 40 |
| Perceptron Mark I | 1957–58 | 695,000 |
| Neocognitron | 1980 | 228 million |
| NetTalk | 1987 | 81 billion |
| TD-Gammon | 1992 | 18 trillion |
| NPLM | 2003 | 1.1 petaFLOPs |
| AlexNet | 2012 | 470 petaFLOPs |
| AlphaGo | 2016 | 1.9 million petaFLOPs |
| GPT-3 | 2020 | 314 million petaFLOPs |
| Minerva | 2022 | 2.7 billion petaFLOPs |
Note: One petaFLOP = one quadrillion FLOPs. Source: “Compute Trends Across Three Eras of Machine Learning” by Sevilla et. al, 2022.
The result of this growth in computation, along with the availability of massive data sets and better algorithms, has yielded a lot of AI progress in seemingly very little time. Now AI doesn’t just match, but also beats human performance in many areas.
It’s difficult to say if the same pace of computation growth will be maintained. Large-scale models require increasingly more compute power to train, and if computation doesn’t continue to ramp up it could slow down progress. Exhausting all the data currently available for training AI models could also impede the development and implementation of new models.
However with all the funding poured into AI recently, perhaps more breakthroughs are around the corner—like matching the computation power of the human brain.
Where Does This Data Come From?
Source: “Compute Trends Across Three Eras of Machine Learning” by Sevilla et. al, 2022.
Note: The time estimated to for computation to double can vary depending on different research attempts, including Amodei and Hernandez (2018) and Lyzhov (2021). This article is based on our source’s findings. Please see their full paper for further details. Furthermore, the authors are cognizant of the framing concerns with deeming an AI model “regular-sized” or “large-sized” and said further research is needed in the area.
Methodology: The authors of the paper used two methods to determine the amount of compute used to train AI Models: counting the number of operations and tracking GPU time. Both approaches have drawbacks, namely: a lack of transparency with training processes and severe complexity as ML models grow.

This article was published as a part of Visual Capitalist's Creator Program, which features data-driven visuals from some of our favorite Creators around the world.


Technology
Countries With the Highest Rates of Crypto Ownership
While the U.S. is a major market for cryptocurrencies, two countries surpass it in terms of their rates of crypto ownership.


Countries With the Highest Rates of Crypto Ownership
This was originally posted on our Voronoi app. Download the app for free on iOS or Android and discover incredible data-driven charts from a variety of trusted sources.
This graphic ranks the top 10 countries by their rate of cryptocurrency ownership, which is the percentage of the population that owns crypto. These figures come from crypto payment gateway, Triple-A, and are as of 2023.
Data and Highlights
The table below lists the rates of crypto ownership in the top 10 countries, as well as the number of people this amounts to.
| Country | % of Population Who Own Crypto | # of Crypto Owners |
|---|---|---|
| 🇦🇪 United Arab Emirates | 30.4 | 3M |
| 🇻🇳 Vietnam | 21.2 | 21M |
| 🇺🇸 U.S. | 15.6 | 53M |
| 🇮🇷 Iran | 13.5 | 12M |
| 🇵🇭 Philippines | 13.4 | 16M |
| 🇧🇷 Brazil | 12 | 26M |
| 🇸🇦 Saudi Arabia | 11.4 | 4M |
| 🇸🇬 Singapore | 11.1 | 665K |
| 🇺🇦 Ukraine | 10.6 | 4M |
| 🇻🇪 Venezuela | 10.3 | 3M |
Note that if we were to rank countries based on their actual number of crypto owners, India would rank first at 93 million people, China would rank second at 59 million people, and the U.S. would rank third at 52 million people.
The UAE Takes the Top Spot
The United Arab Emirates (UAE) boasts the highest rates of crypto ownership globally. The country’s government is considered to be very crypto friendly, as described in Henley & Partners’ Crypto Wealth Report 2023:
In the UAE, the Financial Services Regulatory Authority (FSRA-ADGM) was the first to provide rules and regulations regarding cryptocurrency purchasing and selling. The Emirates are generally very open to new technologies and have proposed zero taxes for crypto owners and businesses.
Vietnam leads Southeast Asia
According to the Crypto Council for Innovation, cryptocurrency holdings in Vietnam are also untaxed, making them an attractive asset.
Another reason for Vietnam’s high rates of ownership could be its large unbanked population (people without access to financial services). Cryptocurrencies may provide an alternative means of accessing these services without relying on traditional banks.
Learn More About Crypto From Visual Capitalist
If you enjoyed this post, be sure to check out The World’s Largest Corporate Holders of Bitcoin, which ranks the top 12 publicly traded companies by their Bitcoin holdings.

-

 Markets5 days ago
Visualizing Global Inflation Forecasts (2024-2026)
-

 Green2 weeks ago
The Carbon Footprint of Major Travel Methods
-

 United States2 weeks ago
Visualizing the Most Common Pets in the U.S.
-

 Culture2 weeks ago
The World’s Top Media Franchises by All-Time Revenue
-

 Best of1 week ago
Best Visualizations of April on the Voronoi App
-

 Wealth1 week ago
Charted: Which Country Has the Most Billionaires in 2024?
-

 Business1 week ago
The Top Private Equity Firms by Country
-

 Markets1 week ago
The Best U.S. Companies to Work for According to LinkedIn